
Data Analytics
Taking complex information or data and making it understandable to everyone is one of my favorite things to do, so when I got on the data visualization project, I loved it. No one likes to look at spreadsheets to find information trends when we can pull up the information they need to see to plan and make future decisions for their business.
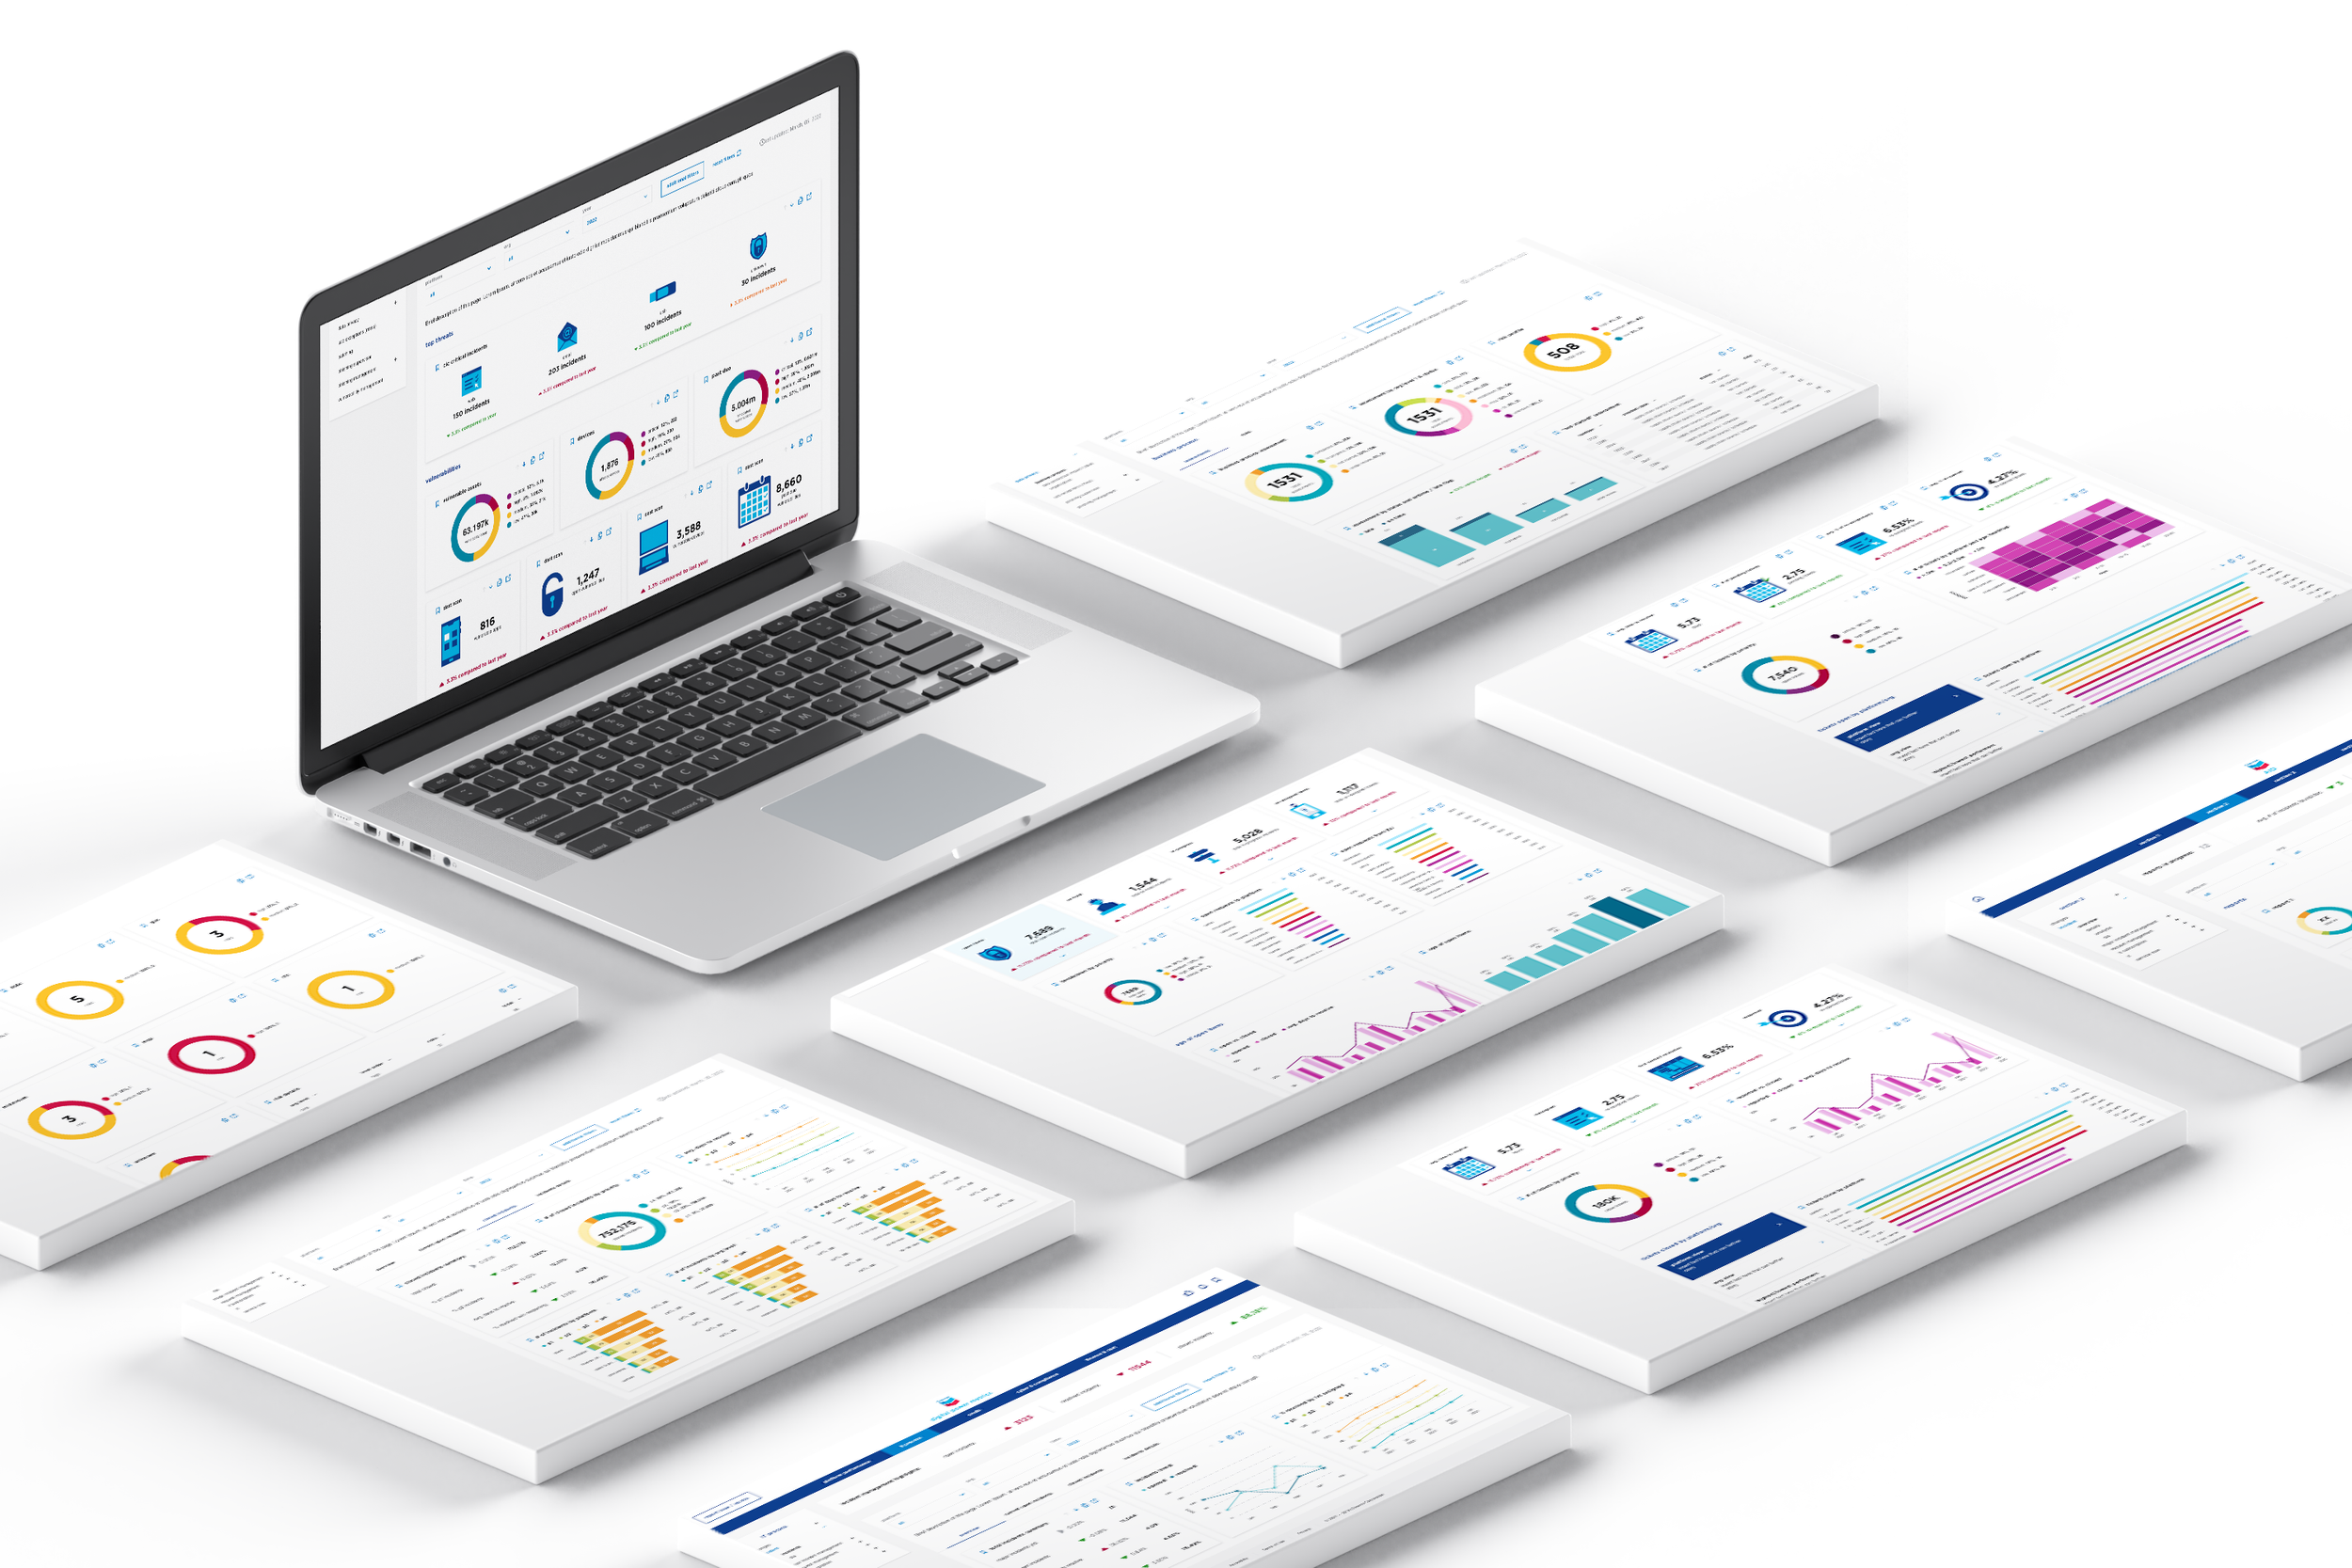
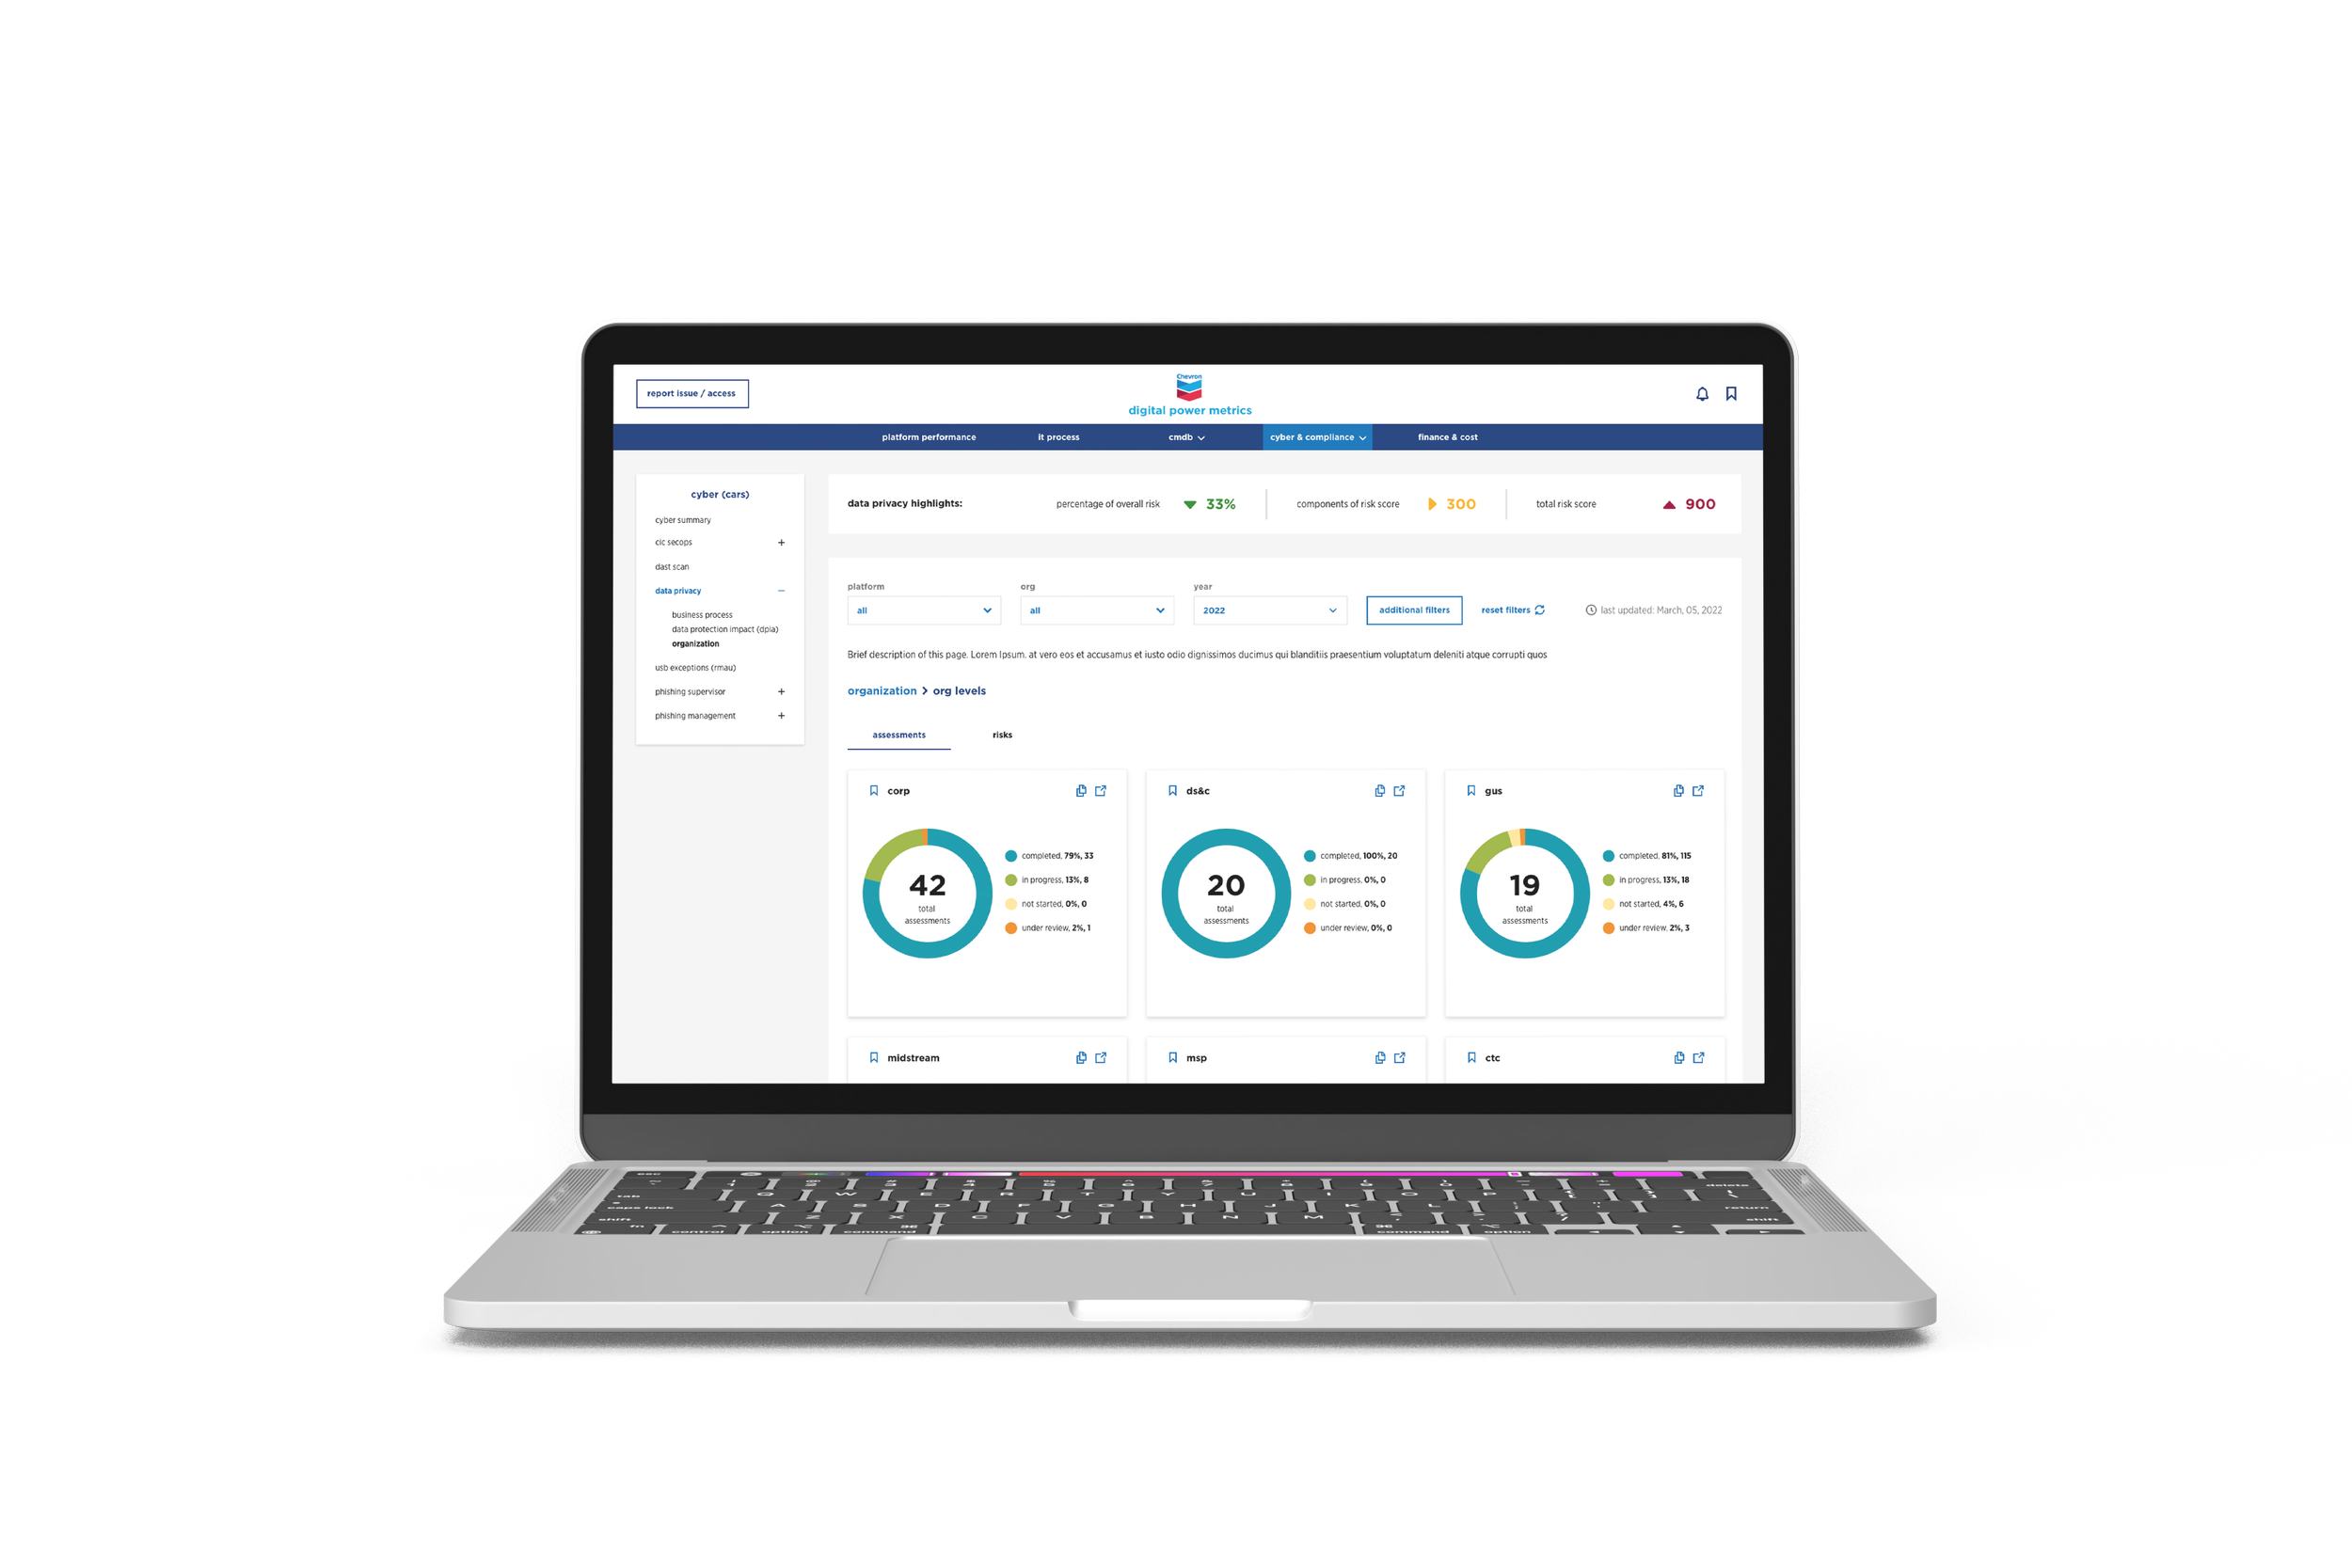
For this project, they had their data going through Powerbi and the challenge was to re-create the information coming through in a more efficient and appealing way. Below is an example of what I received versus what I created for them.
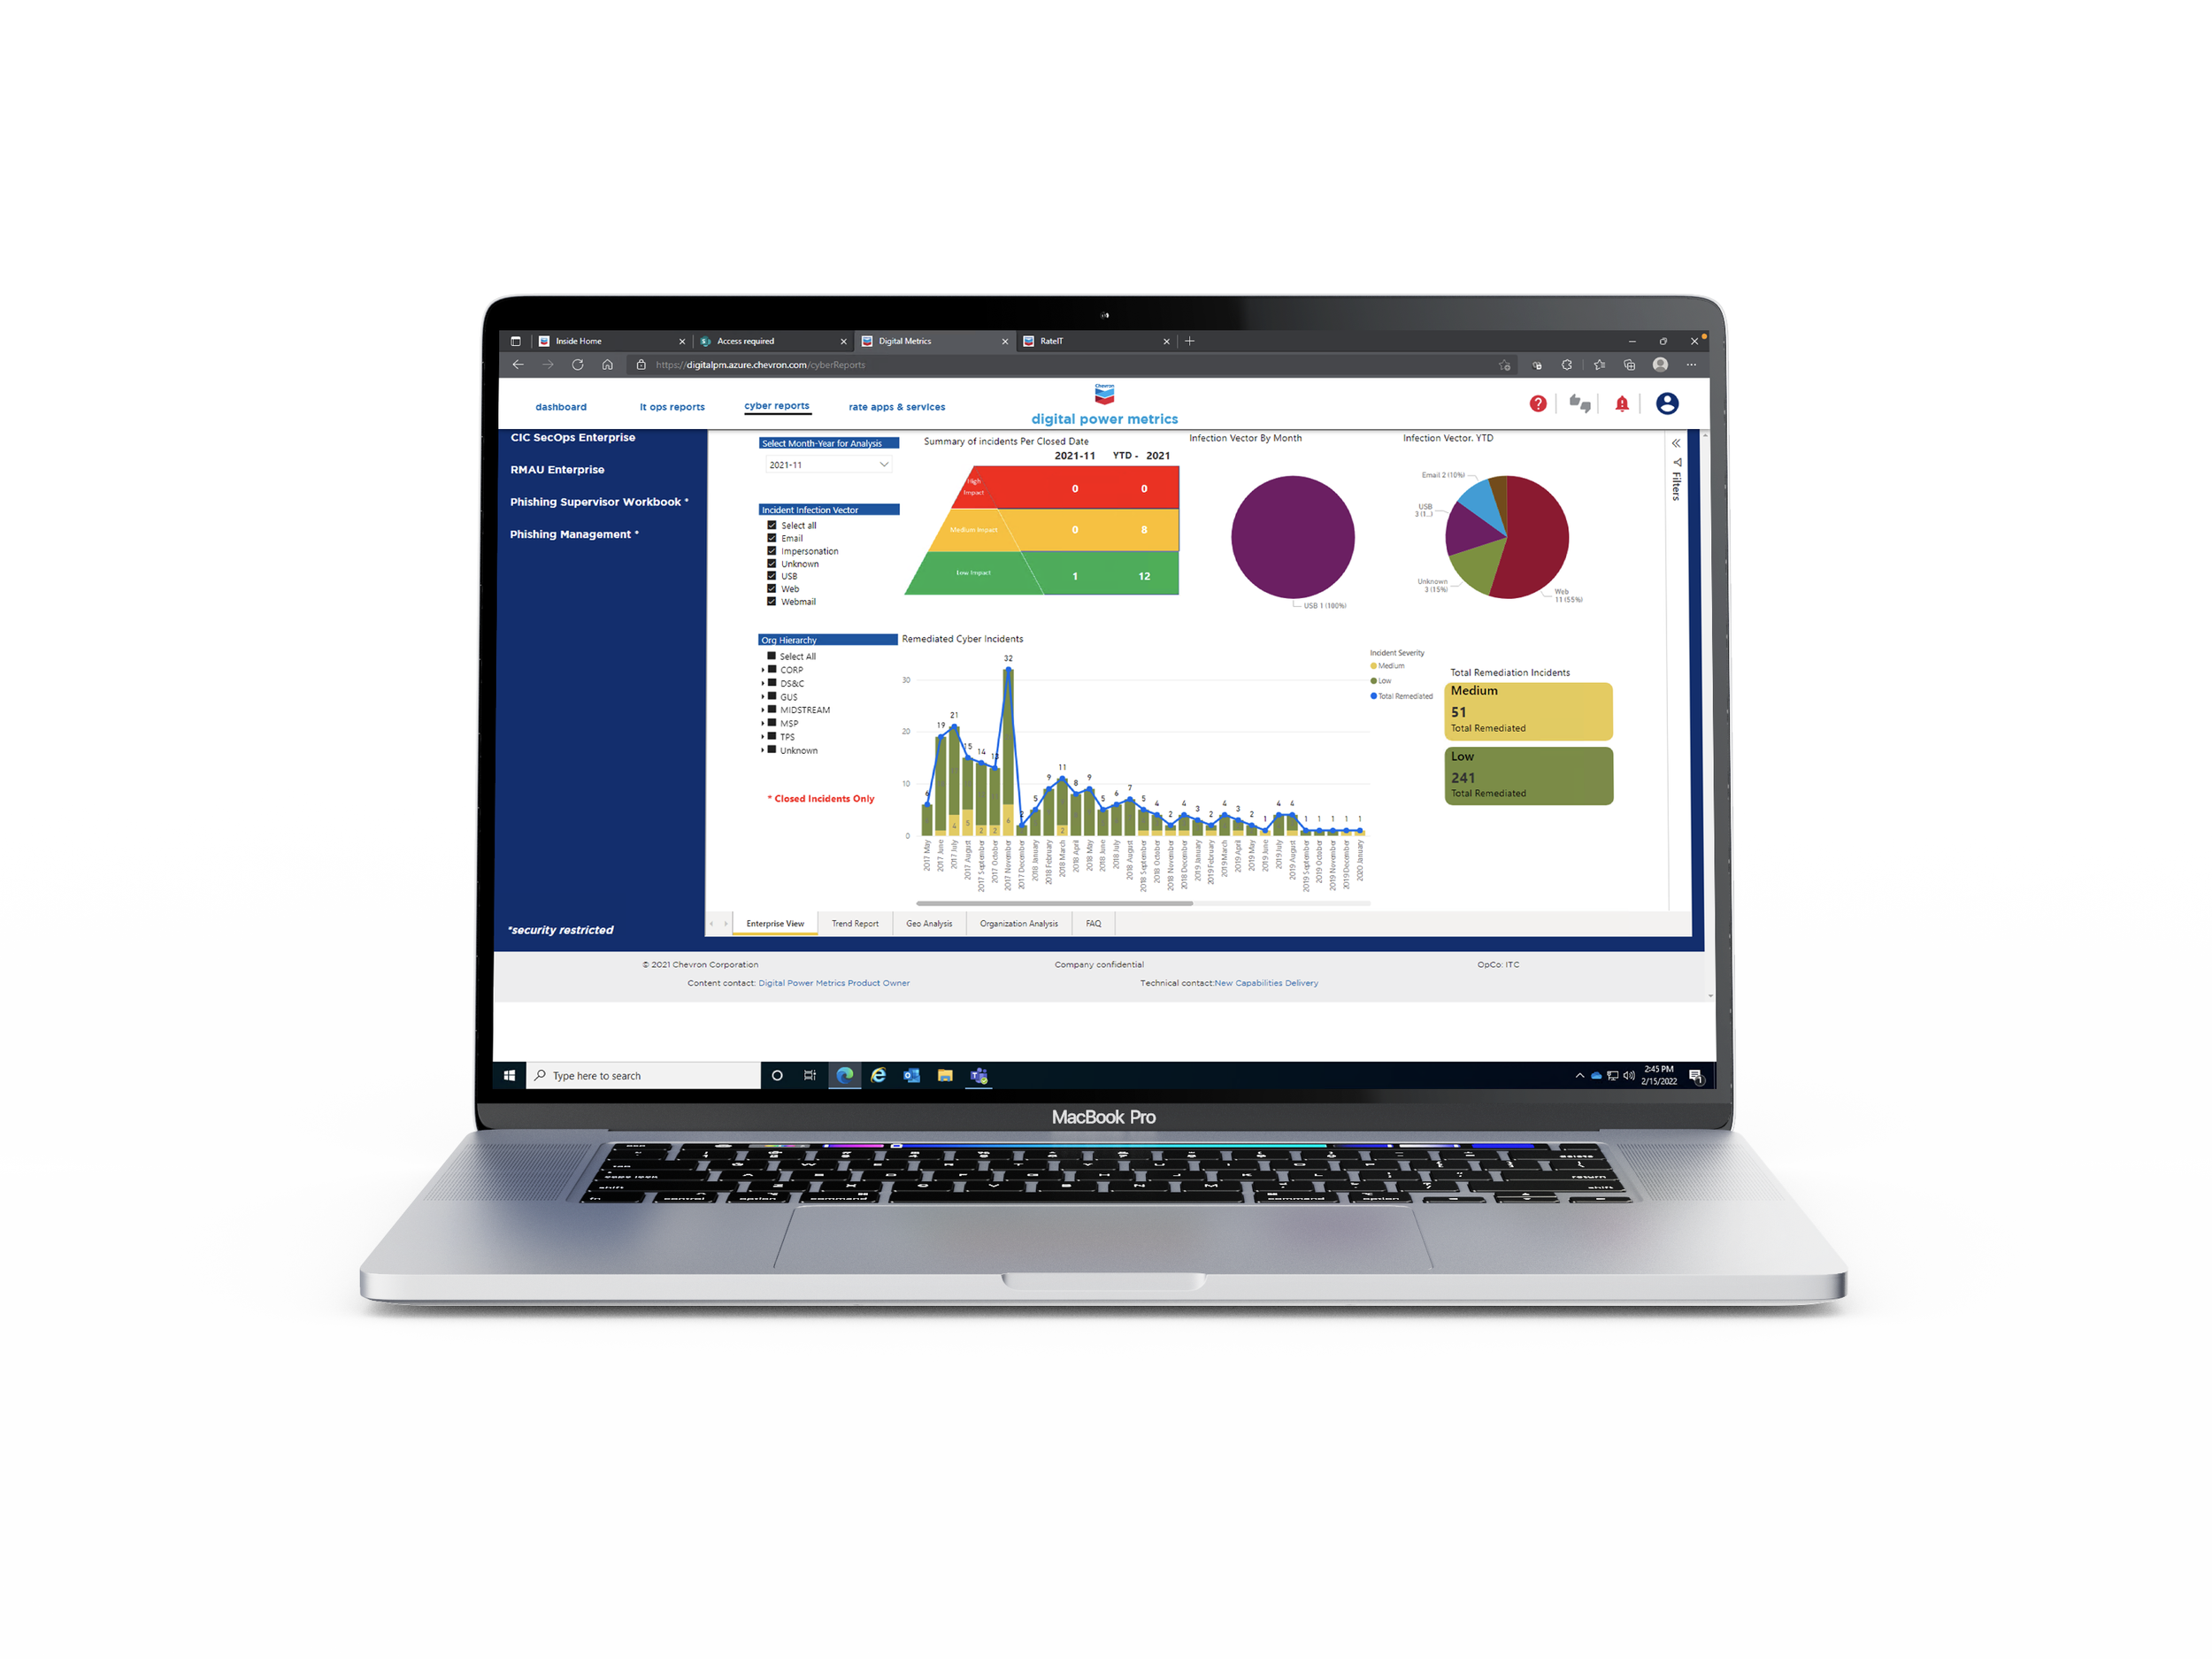

Before + After

Data Organization Levels
Want to Learn More?
Curious about other projects I’ve done with Data Analytics or want to discuss more? Please email me via the button below to get in touch with me!